Service Logs
Observability → Logs reads a listener's logs straight from every client that runs it: Envoy's own log
(<listener>-<admin port>_system.log) and the listener's access log
(<listener>-<admin port>_access.log), including logrotate's older copies (.1, .2.gz … .5.gz).
Nothing is shipped or indexed centrally for this view — the query runs on the proxy host and returns
one page at a time.
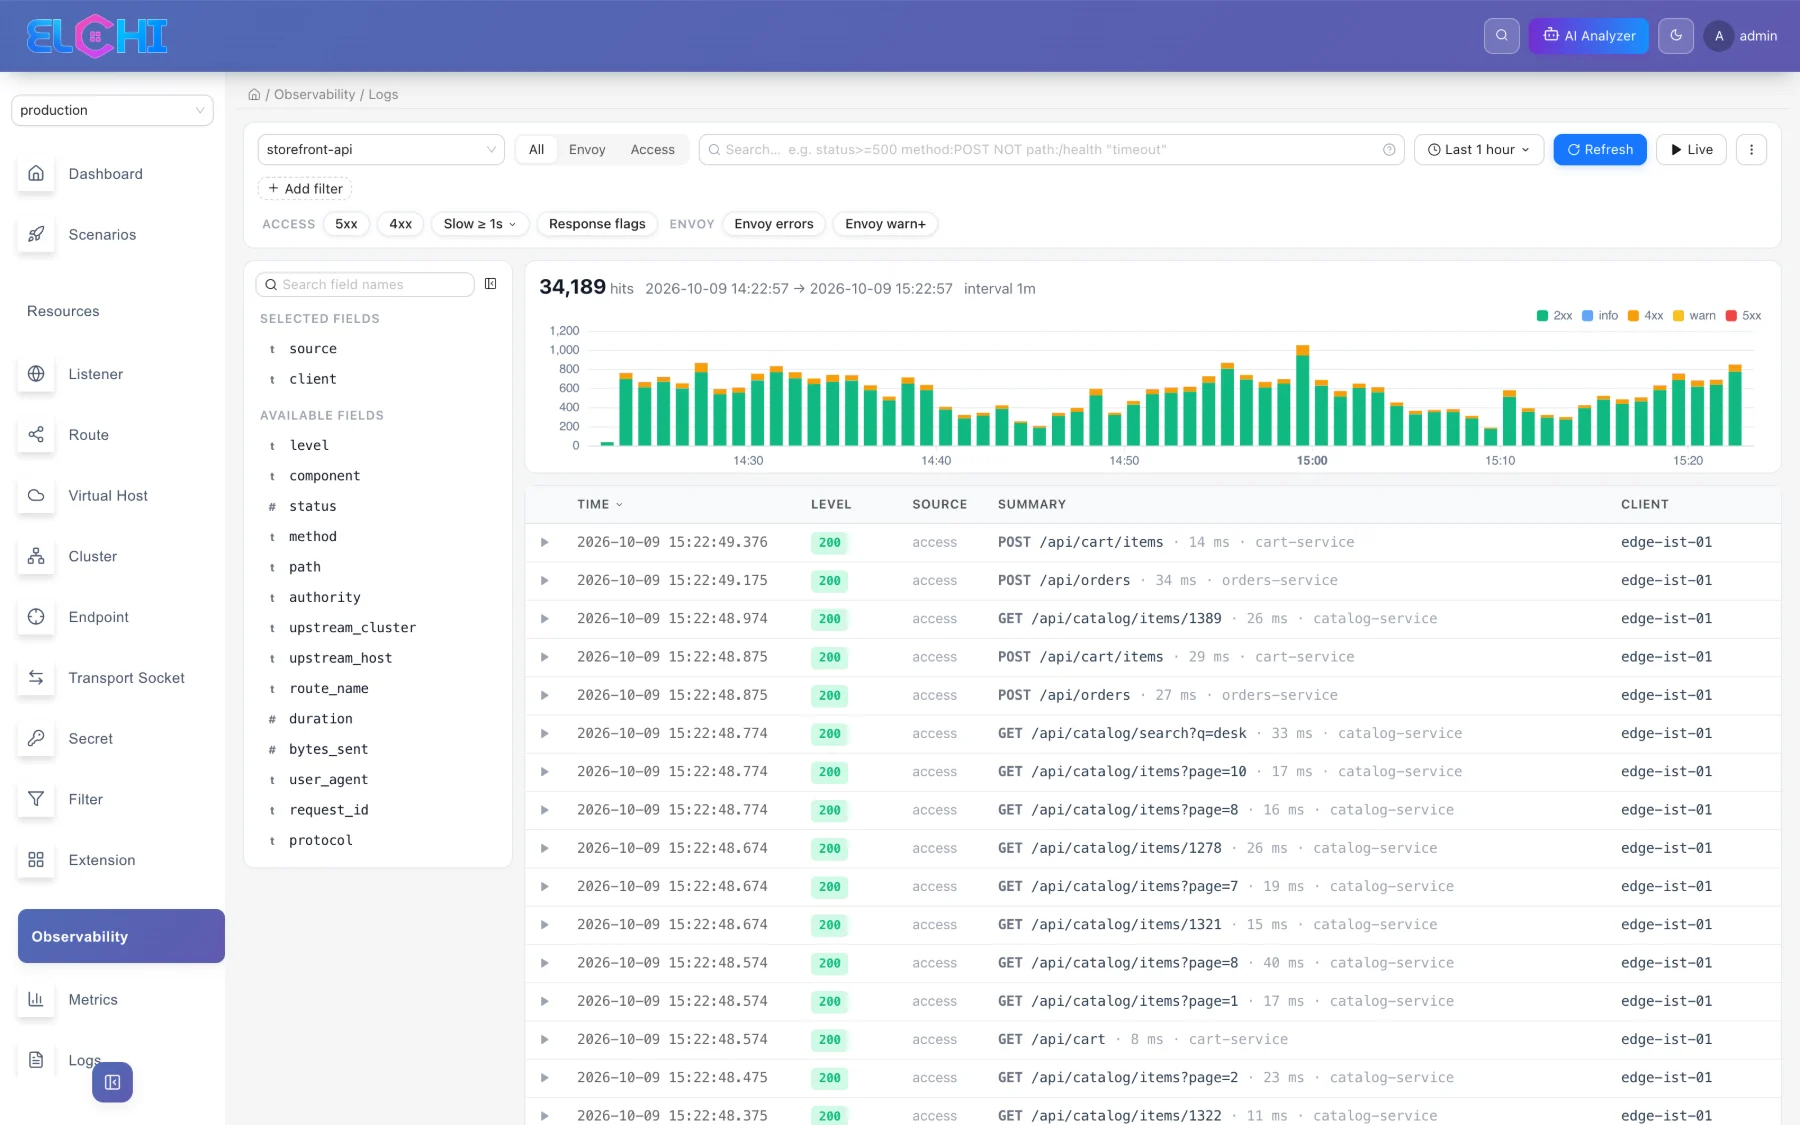
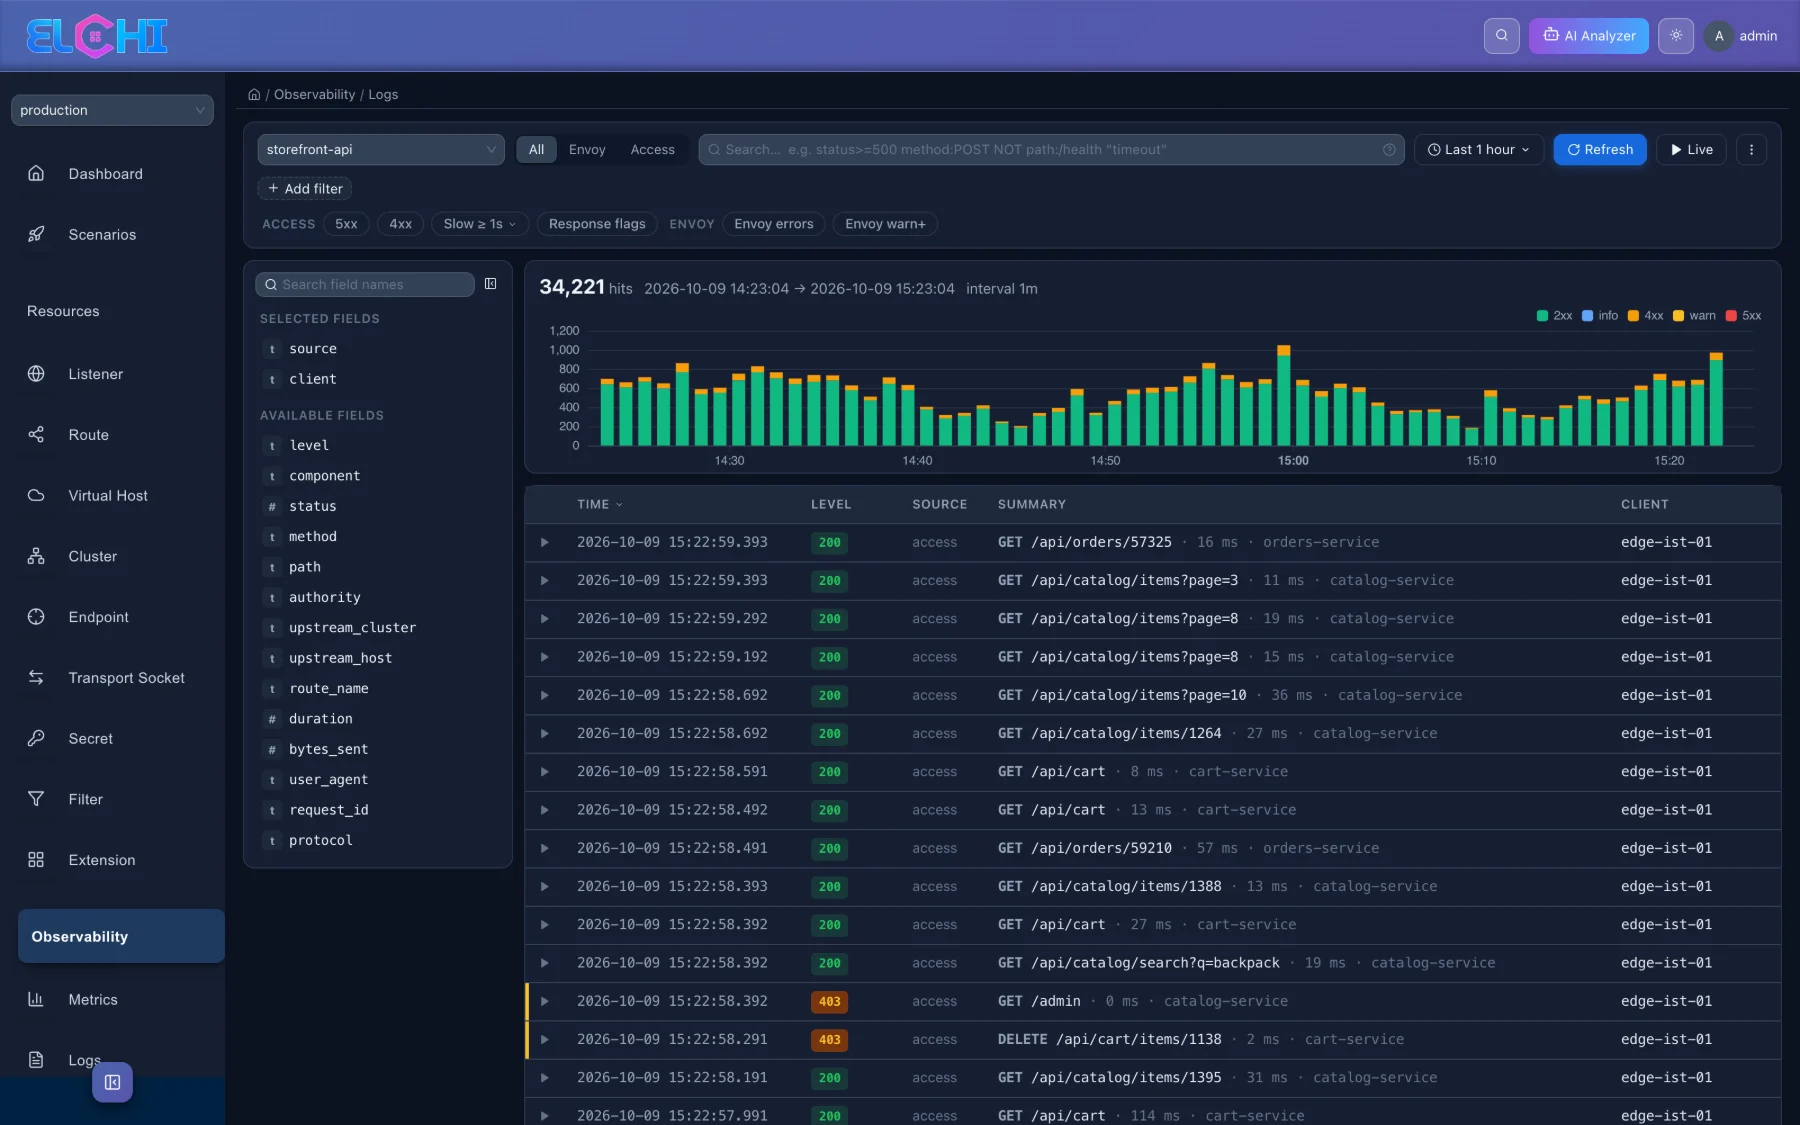
Layout
| Area | What it does |
|---|---|
| Service | The listener to read. A link to the page keeps the service, source, query and time range (?service=…&source=…&q=…&from=…). |
| All / Envoy / Access | Which log to read. All merges both by time. |
| Query bar | Free text and field conditions, evaluated on the proxy host (syntax below). Press Enter to run. |
| Time picker | Quick ranges (15 minutes … 7 days, last 1 hour by default) or an absolute range. |
| Refresh | Runs the query again. A relative range moves forward to now. |
| Live | Live tail: every 2 s new entries are added on top without resetting the table (opened rows stay open). Each poll reads only the last ~30 seconds of log (late-flushed lines included) and starts after the previous one ends; every 15 s the whole range is re-read for an exact total and histogram. Scrolling down or opening a row pauses it and shows how many newer entries arrived; Resume continues. Needs a relative range. |
| Quick chips | One-click triage filters, per log: Access — 5xx, 4xx, Slow ≥ 1 s (threshold 250 ms … 3 s), Response flags; Envoy — errors, warn and above. |
| Filters | Add filter builds a condition from a field, an operator and a value. Click a filter to exclude instead of include, disable it temporarily or delete it. |
| Histogram | Matching entries per interval, stacked by status class (access) or level (Envoy). Click a bar to zoom into it, or drag across the chart to select a range. |
| Fields | The fields of the current page with their top five values. + / − filters for or out of a value; the column button adds the field to the table. |
| Row actions | Show surrounding — up to 50 entries before and after on the same client, Envoy and access logs, without filters. Trace request — every access log entry with the same x-request-id on all clients (±5 minutes) and what Shield decided about it. |
| Table | Newest first. Hover a value for + / − (filter for or out of it); drag a column header to move the column (the order is kept per view in the browser; ⋮ → Reset columns restores it). Access entries show status, method, path, duration, upstream cluster and client; Envoy entries show level, component and message. Click a row for every field (Table), the parsed record (JSON) or the original line (Raw). |
| Paging | 500 entries per page (100 – 1000 selectable) and the exact number of matches in the range. |
Query syntax
| Query | Meaning |
|---|---|
timeout | Entries containing the word, any case (all words must occur). Matches the access line, or an Envoy entry's message — use level: / component: for those |
"connect error" | A phrase |
status:5xx · status:404 | Status class or code |
status>=400 · duration>250 | Numeric comparison (>, >=, <, <=) |
method:POST · path:/api/* | Field match on the whole value; * is a wildcard |
path:*checkout · user_agent:curl* | Ends with / starts with |
level:error · component:upstream | Envoy log fields |
NOT path:/health · -debug | Negation |
Conditions are combined with AND. Fields: level, component, source, message, status,
method, path, protocol, authority, upstream_cluster, upstream_host, response_flags,
route_name, user_agent, request_id, duration, bytes_sent. Access-log fields are read from
JSON keys (common aliases such as response_code/status, uri/path are recognised) or from
the text layouts Elchi and Envoy ship.
The access log format decides what you can filter
The access log format is yours: Envoy writes only the command operators you put in it. Elchi reads the listener's live format from the proxy and parses each line by it, so custom text and JSON formats work — but a field exists only when its operator is in the format. A chip or action that needs a missing field is disabled and tells you which operator to add (with a link to the access log extension):
| Feature | Needs the operator |
|---|---|
5xx / 4xx chips, status: | %RESPONSE_CODE% |
Slow chip, duration> | %DURATION% |
| Response flags chip | %RESPONSE_FLAGS% |
| Trace request | %REQ(X-REQUEST-ID)% |
method: / path: | %REQ(:METHOD)% / %REQ(X-ENVOY-ORIGINAL-PATH?:PATH)% |
upstream_cluster: | %UPSTREAM_CLUSTER% |
A File Access Log without a format uses Envoy's default format, which logs all of these except
%UPSTREAM_CLUSTER%.
When you create or edit an access logger, Log Format → Preset fills the format for you, as JSON or
text: Essential (time, method, path, status, duration, request id — the smallest line that keeps
the 5xx/4xx, Slow and Trace actions), Standard (recommended — every operator above; the JSON variant
is the same as default-aclog-file-json) and Troubleshooting (Standard plus connection and TLS
detail such as termination reason, upstream transport failure, retries, TLS version/cipher and SNI).
Access logs need a File Access Log
The Access view reads the file the listener writes. Add a File Access Log extension (text or JSON
format) to the listener's HTTP connection manager; on a managed listener Elchi writes it to
/var/log/elchi/<listener>-<admin port>_access.log whatever path the extension names.
When the listener has none, the page offers Enable access log: it attaches the project's default
JSON logger default-aclog-file-json (every operator in the table above) to the listener's HTTP
connection manager(s) and publishes it live, after a confirmation.
A Stdout access logger is not shown here: the proxy's standard output goes to the system journal. Envoy writes a file access log in batches, so a request can take a few seconds to appear.
Response flags (for example UH, NR, UF, DPE) mean Envoy handled the request itself instead of
passing the backend's answer through — the flag is the reason, the status code only the result. With the
Response flags chip (or a response_flags filter) the table gains a Flags column and a summary
above it lists each flag on the page with its count, its meaning and where to look first (click a code to
keep only that flag); an opened entry and the column's tooltip show the same. Flags are shown with their meaning; times are shown in your
browser's time zone with the UTC time on hover.
Temporary debug levels
⋮ → Log level settings changes the level of Envoy's own log (all loggers, or one component such as
router, upstream or ext_proc). This affects the Envoy view, not the access log. A change lasts
5, 15 or 30 minutes (default 15) and the agent then restores the levels the proxy had before — also
after an agent restart. The drawer shows the countdown and Revert now; choosing Permanent keeps
the change and cancels a pending revert. An Envoy restart starts at the default levels anyway.
Limits
- A page holds at most 1000 entries; a query scans at most two million entries. When a scan stops at that limit the page says how far back it counted — narrow the time range or add filters.
- Agents older than the time-range query (elchi-proto 1.0.3) answer with their newest 5,000 lines; the page filters and pages those in the browser and shows an upgrade notice.
- To keep logs beyond logrotate's five rotations, forward them with the client agent's Syslog or Elastic export.
For triage, AI log analysis explains the entries of the current page.