Metrics & Logs
The telemetry pipeline
Elchi emits several distinct signal classes, and each takes a different path to storage. Knowing which signal lands where saves a lot of dashboard-hunting.
- Envoy stats → an OTel Collector → VictoriaMetrics → Grafana (and the in-UI ECharts dashboards). The metrics backbone.
- Envoy access logs (ALS v3) → elchi-collector → ClickHouse (
api_events_raw, forensic) + MongoDB (api_inventory, the endpoint catalog). This is API Discovery — a traffic-derived inventory, not a metrics stream. - Shield metrics → scraped at
/metrics(elchi_shield_*), and also pushed over OTLP when--metrics-otlp-endpointis set. Shield security events + audit → ClickHouse. See Shield Observability. - Service logs → the in-UI log viewer, and optionally forwarded by the client agent to Syslog / Elastic-Logstash.
Signals → destinations
| Signal | Source | Transport | Lands in | Surfaced by |
|---|---|---|---|---|
| Envoy proxy stats | Edge Envoy | stats-sink → OTLP (4317/4318) | VictoriaMetrics (8428) | UI Metrics (ECharts) + Grafana (3000) |
| Envoy access logs | Edge Envoy | ALS v3 gRPC (18090) | ClickHouse api_events_raw + MongoDB api_inventory | API Discovery |
| Shield metrics | elchi-shield | /metrics scrape (9001) + optional OTLP push | Prometheus/VictoriaMetrics | Shield Observability |
| Shield security events / audit | elchi-shield | direct write | ClickHouse (audit table, TTL'd) | Shield UI / Audit |
| Collector metrics | elchi-collector | /metrics scrape (18091) | Prometheus/VictoriaMetrics | Grafana |
| Config-change audit | Controller | immutable trail | MongoDB | UI Audit + syslog forwarding |
| Service logs | All services | stdout / agent export | Log viewer, Syslog, Elastic | UI Observability → Logs |
The OTLP endpoints (4317/4318), VictoriaMetrics (8428), Grafana (3000), ClickHouse, and the collector ports are all catalogued in the Port Reference.
Metrics
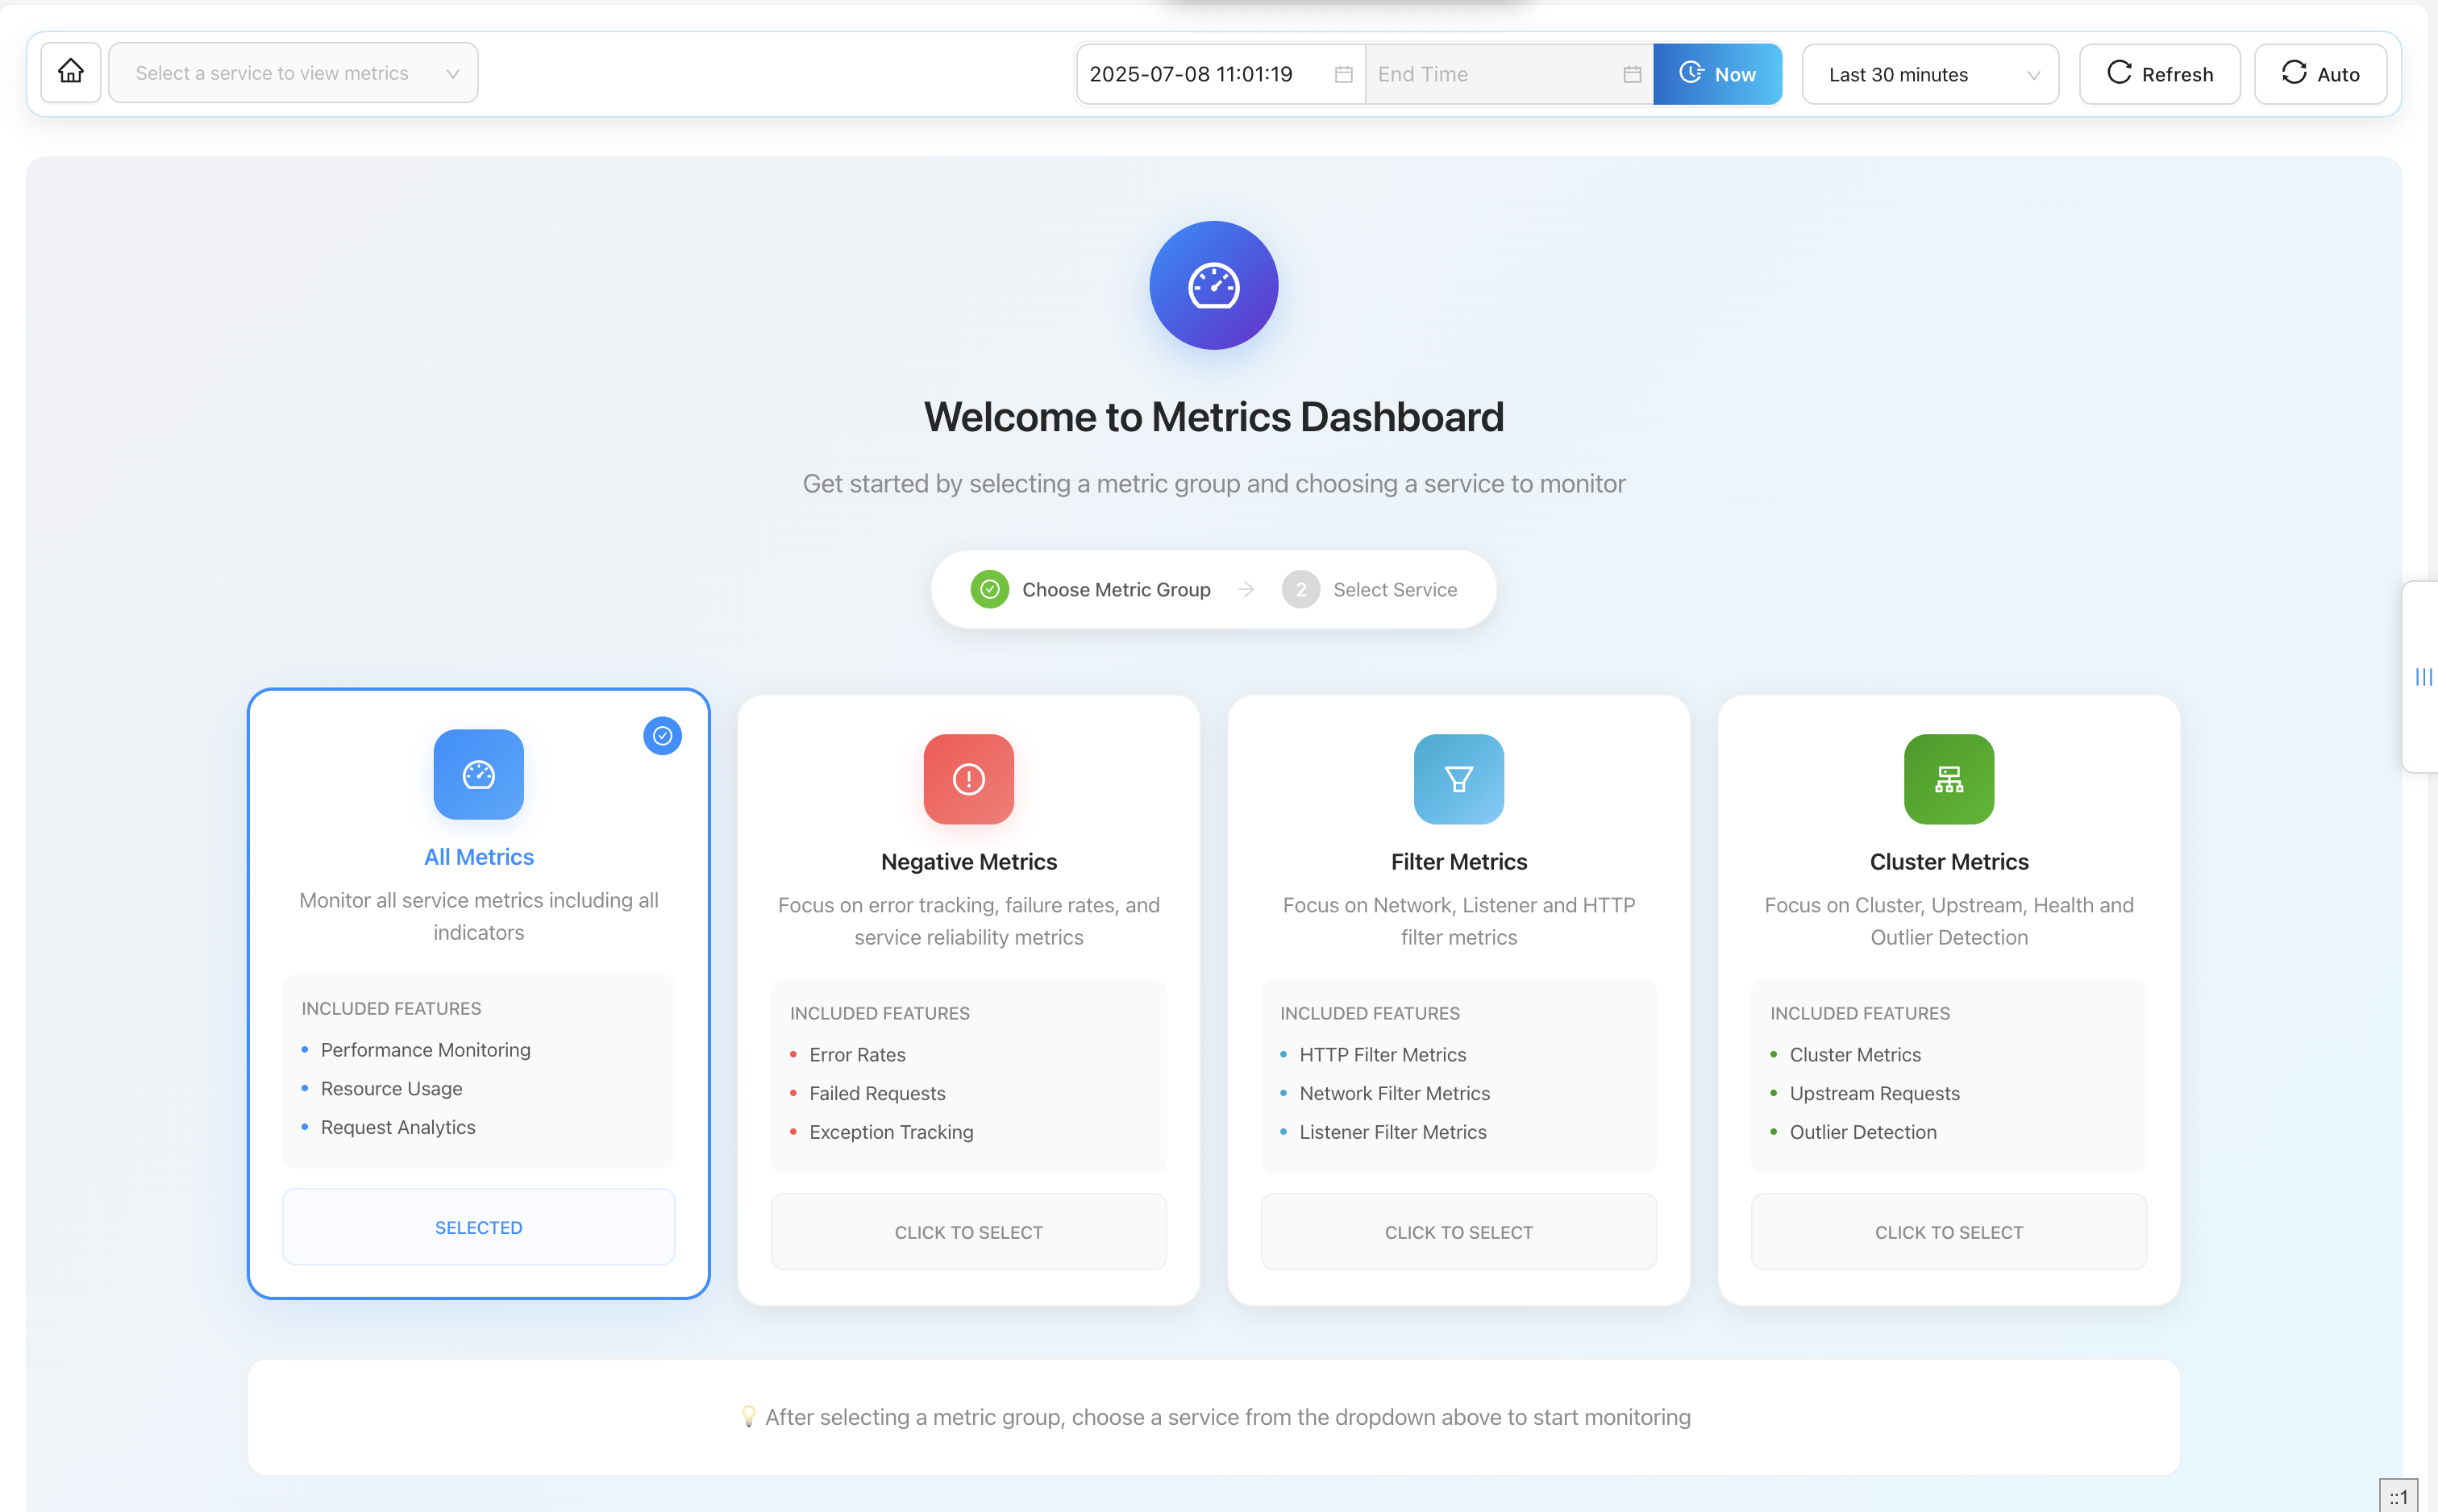
Built-in dashboards (powered by ECharts) chart downstream, upstream, and listener metrics with custom time ranges, grouping, and auto-refresh. For deeper analysis, Elchi integrates Grafana so you can use full Grafana dashboards against the same VictoriaMetrics data. Open Observability → Metrics.
Logs
The log viewer (Observability → Logs) streams service logs with JSON parsing, HTTP access-log detection, level filtering, and search. To centralize logs, the client agent can export to Syslog or Elastic/Logstash. For triage, AI log analysis summarizes and explains log output when an OpenRouter token is configured.
Endpoint discovery
Under Discovery, connected Kubernetes clusters report their services so Envoy clusters always see up-to-date upstreams. See Elchi Discovery to install the agent.