Live Traffic
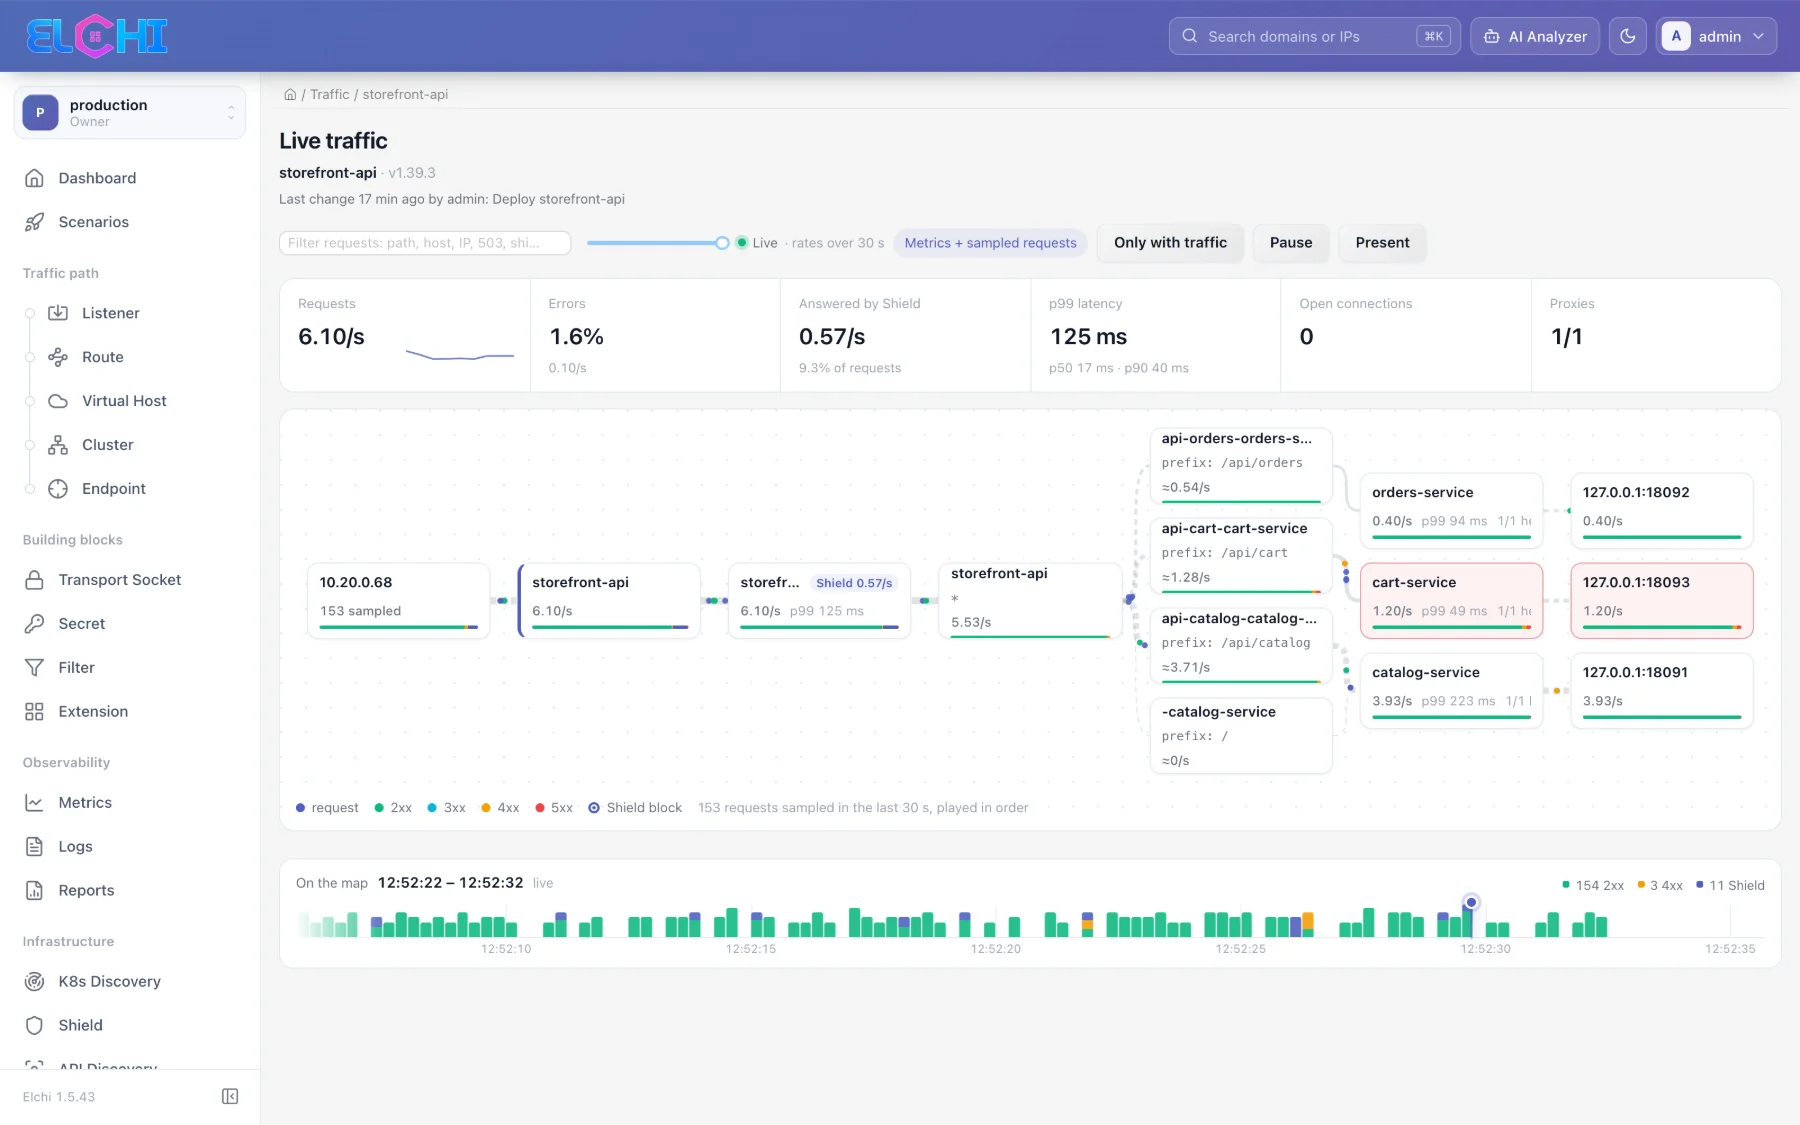
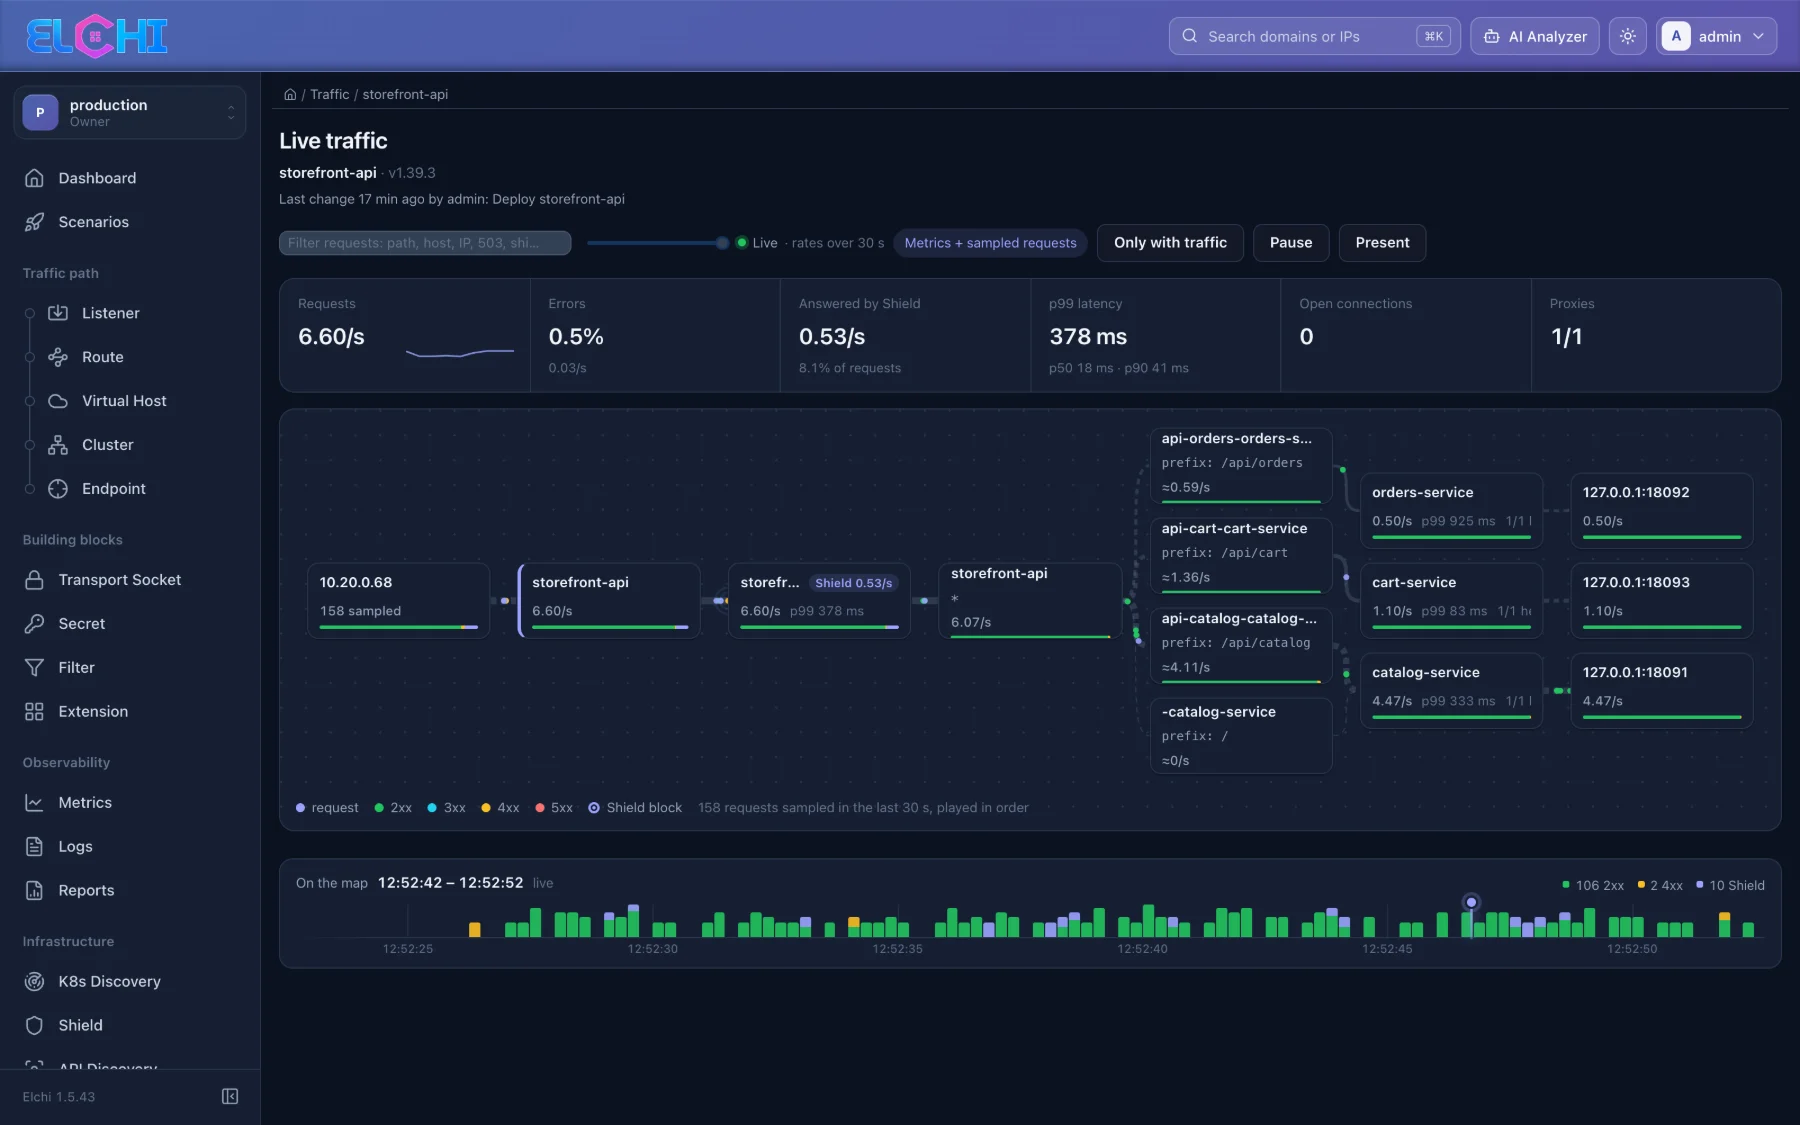
Live traffic draws one listener as it runs. The listener is laid out in columns — sources,
listener, connection managers, domains, routes, clusters, endpoints — and the requests it handled
move across them. Open it from a listener's menu (right click, or the operations menu in the list)
or with the Live traffic button on the listener page; the Envoy version is picked like any other
per-version action. The page lives at /traffic/<listener>.
Where the numbers and the requests come from
| Source | What it gives | How often |
|---|---|---|
| Metrics | Requests a second, response classes, p99 and healthy hosts per connection manager (by stat_prefix) and per cluster, averaged over the last 30 s. All series are read at one moment; a shared stat_prefix is counted once and stale series are left out. Rates split by an estimate are marked ≈. | every 5 s |
| Access log | The newest access log lines from every proxy that runs the listener (fewer per proxy when there are many). Each request is placed by its route name, host and status, and stops where Envoy ended it: no route, a filter, a redirect or direct response, no healthy host, or an endpoint timeout. | every 5 s |
With an access log on the connection manager, the header reads Metrics + sampled requests and each read is played back slice by slice, in the order the requests happened; the source column shows the clients being played. Without one, the dots follow the measured rates (at most 40 a second) and stop at the clusters — nothing is invented for routes or endpoints. Add an access log to the connection manager to see real requests.
A TCP proxy listener shows new connections a second and bytes from the proxy's metrics; TCP has no requests or status codes.
Reading the map
| Element | Meaning |
|---|---|
| Summary row | Requests a second (with a trend), errors (4xx + 5xx), requests answered by Shield (blocks and rate limits), p99 latency with p50 / p90, open connections, and how many proxies answered. |
| Per proxy | The same numbers for each client that runs the listener. Show only this proxy narrows the map to it. |
| Nodes | Each node shows its rate and, for clusters, p99 and healthy hosts. A bar under the node splits it by response class. |
| Colours | Requests are coloured by class: 2xx, 3xx, 4xx, 5xx, and Shield blocks. A node is tinted where the 5xx came from — the upstream, or the stage that answered — from 2 % and stronger from 10 %. |
| Folded nodes | Quiet nodes fold into +N more; expand them to see them (up to 60). |
| Shield | When Shield inspects the listener, its blocks are matched to requests by request id and marked on the map (owners and admins). |
Node detail
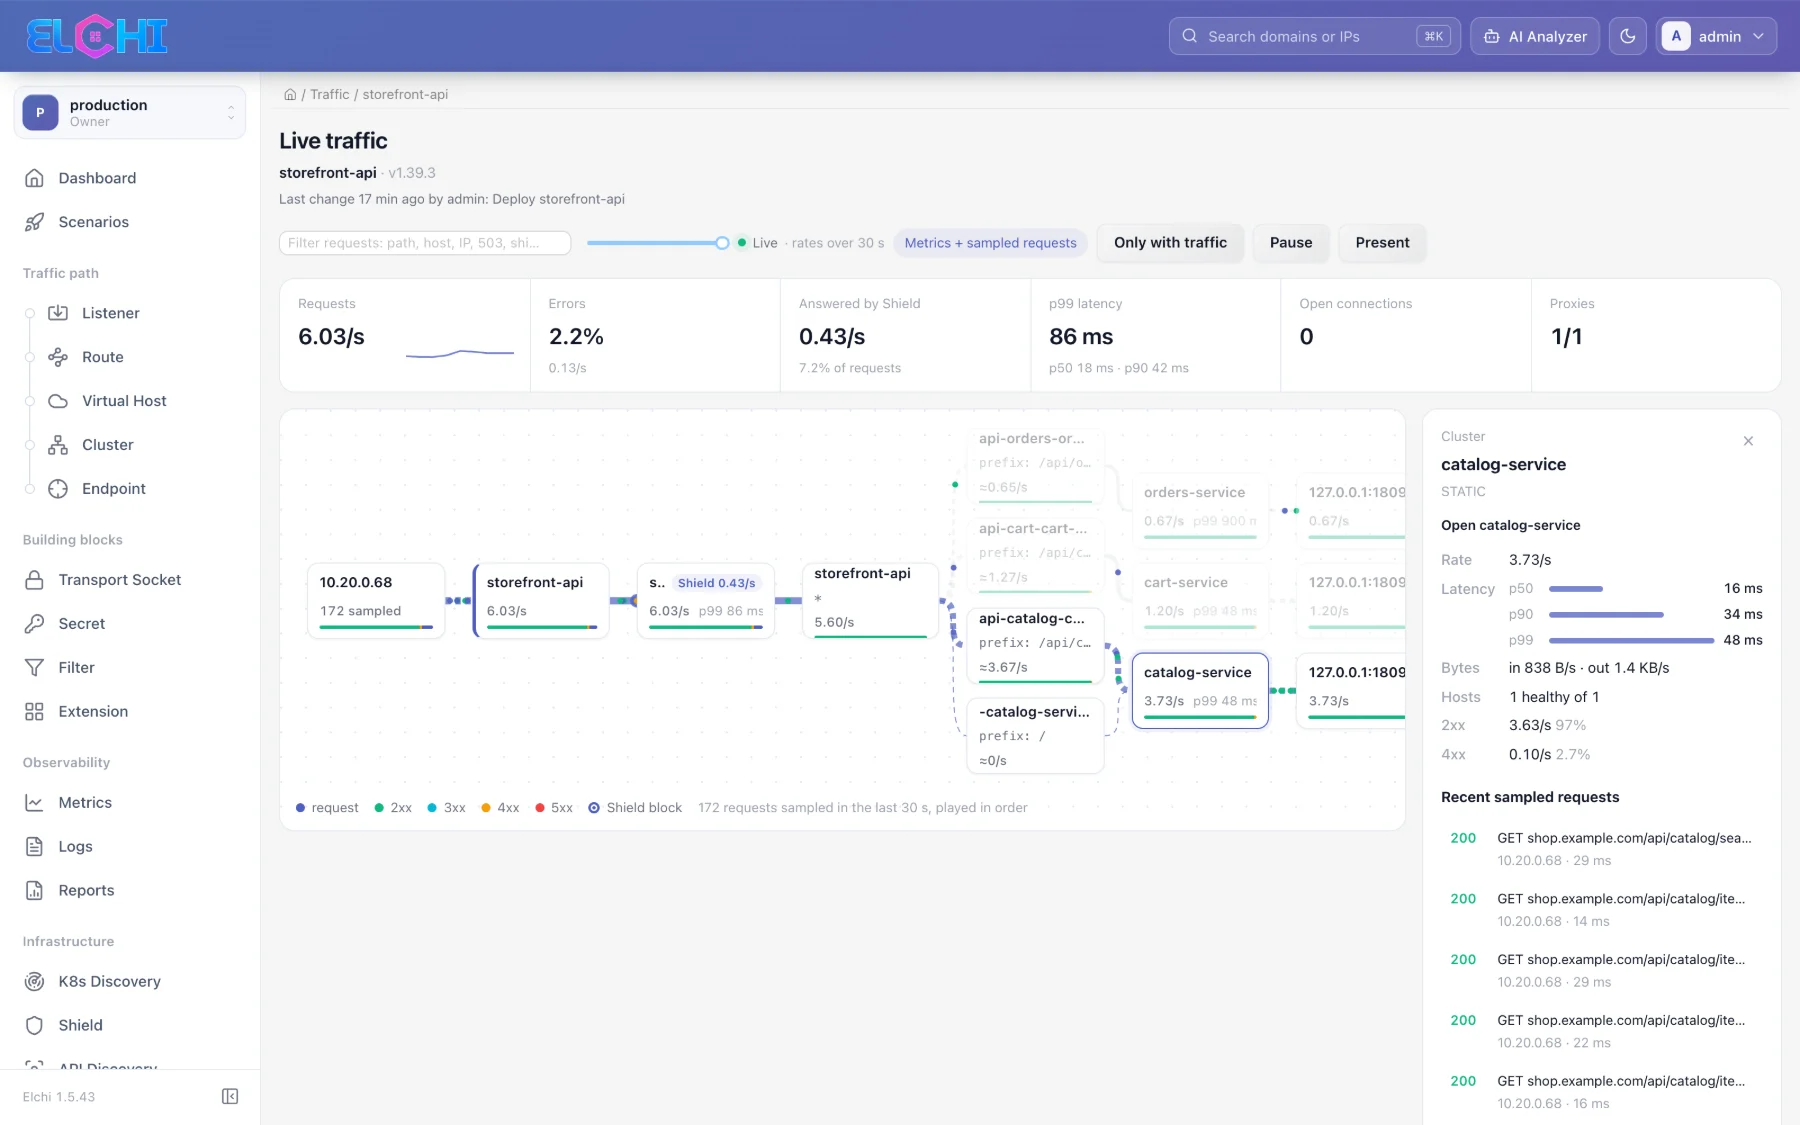
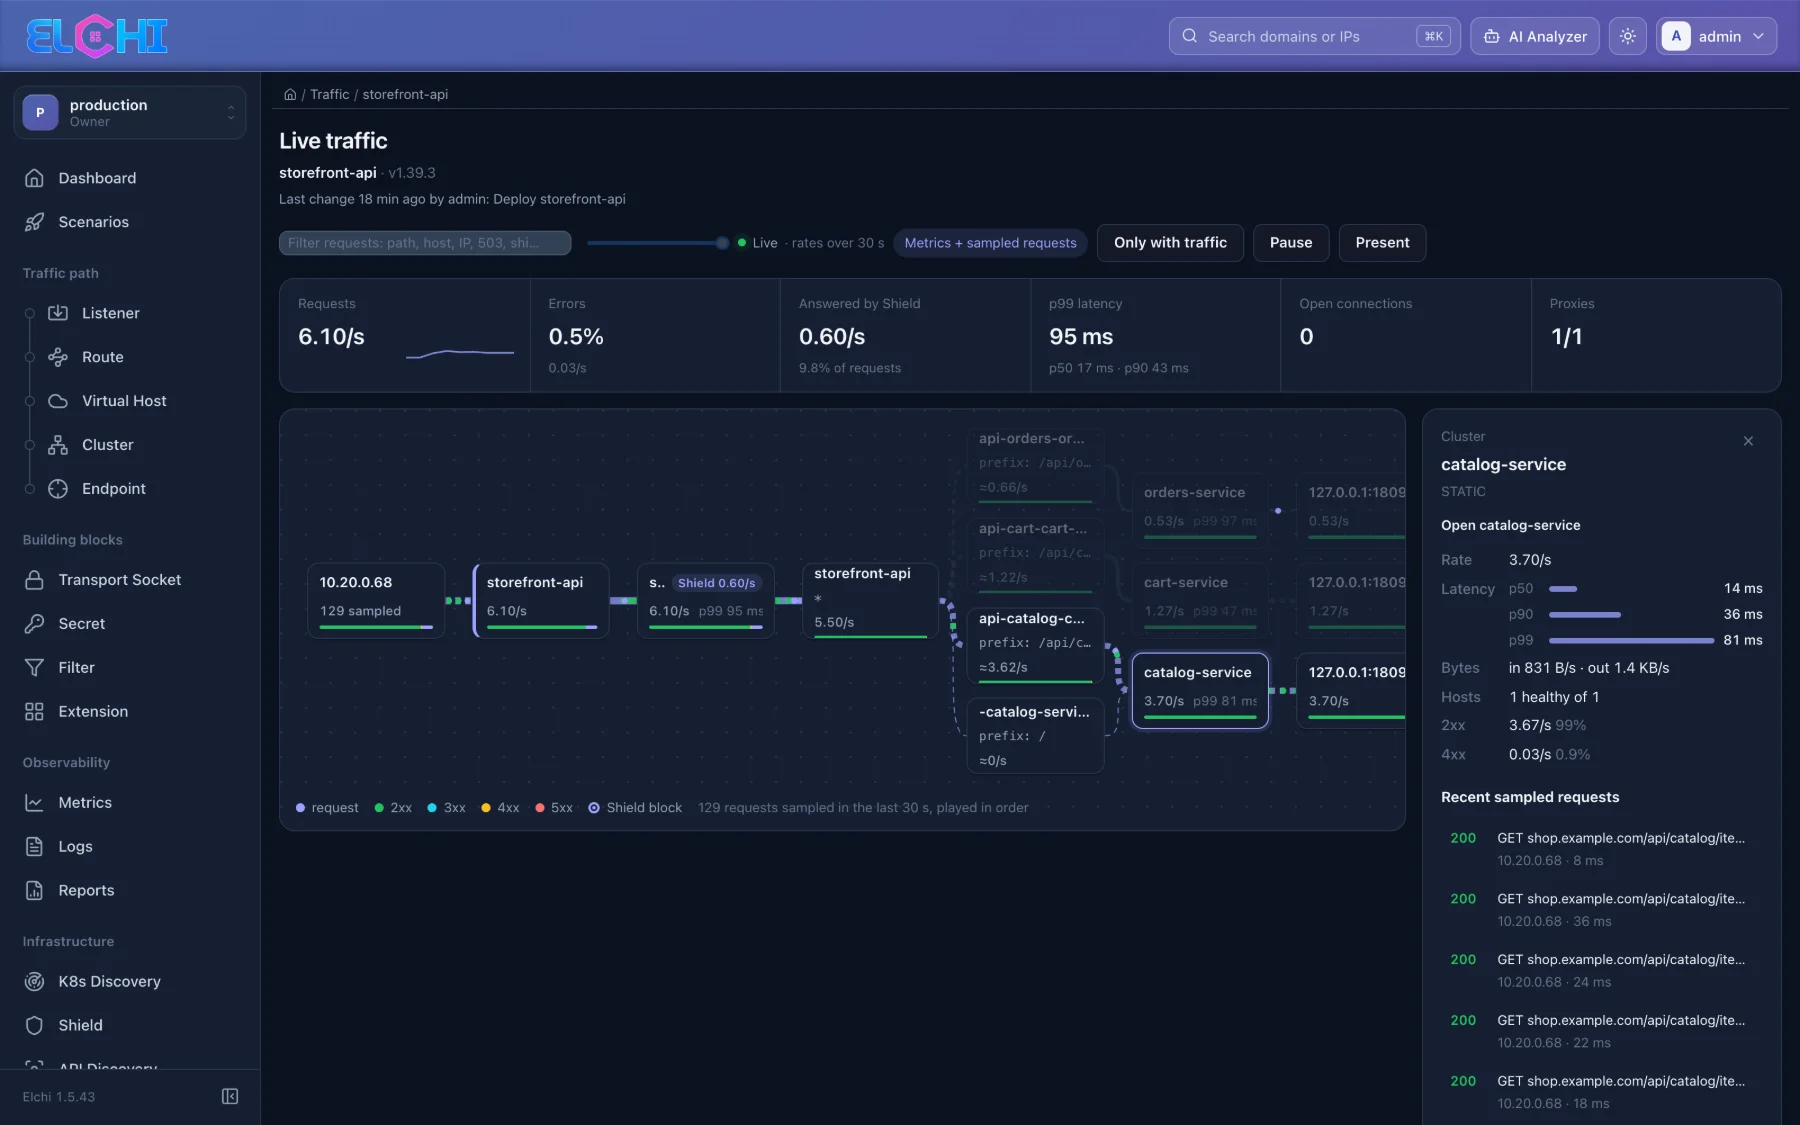
Click a node — a domain, route, cluster or endpoint — for a side panel with its rate, latency percentiles, bytes, response classes, healthy hosts and the recent sampled requests that went through it. Each request links to Logs; Follow this request on the map highlights its path. A selected source stays drawn while its panel is open.
Controls
| Control | What it does |
|---|---|
| Filter requests | Keeps the sampled requests that match a path, host, IP, status (503) or shield. |
| Replay slider | Goes back to a moment of the last 5 minutes: the 30 s before it, its rates, and its sampled requests played once more. Live returns to now. |
| Only with traffic | Hides domains, routes, clusters and endpoints that carried no request. |
| Pause | Stops reading and playing. The page also idles when nothing moves, when the tab is hidden or the map is off screen, and respects reduced motion. |
| Present | Fills the screen with the view, for a wall screen. Esc goes back. |
| On the map | The strip under the map: when the moving requests happened, by class. |
Notes the page shows
- Not deployed — the listener runs on no client yet, so there is nothing to show.
- No HTTP — the listener has neither an HTTP connection manager nor a TCP proxy.
- No access log — rates come from metrics and stop at the clusters.
- No requests in the last 30 s — the rates are 30 s averages and are still coming down.
- Replay stops 15 s after the last new request.