The Dashboard
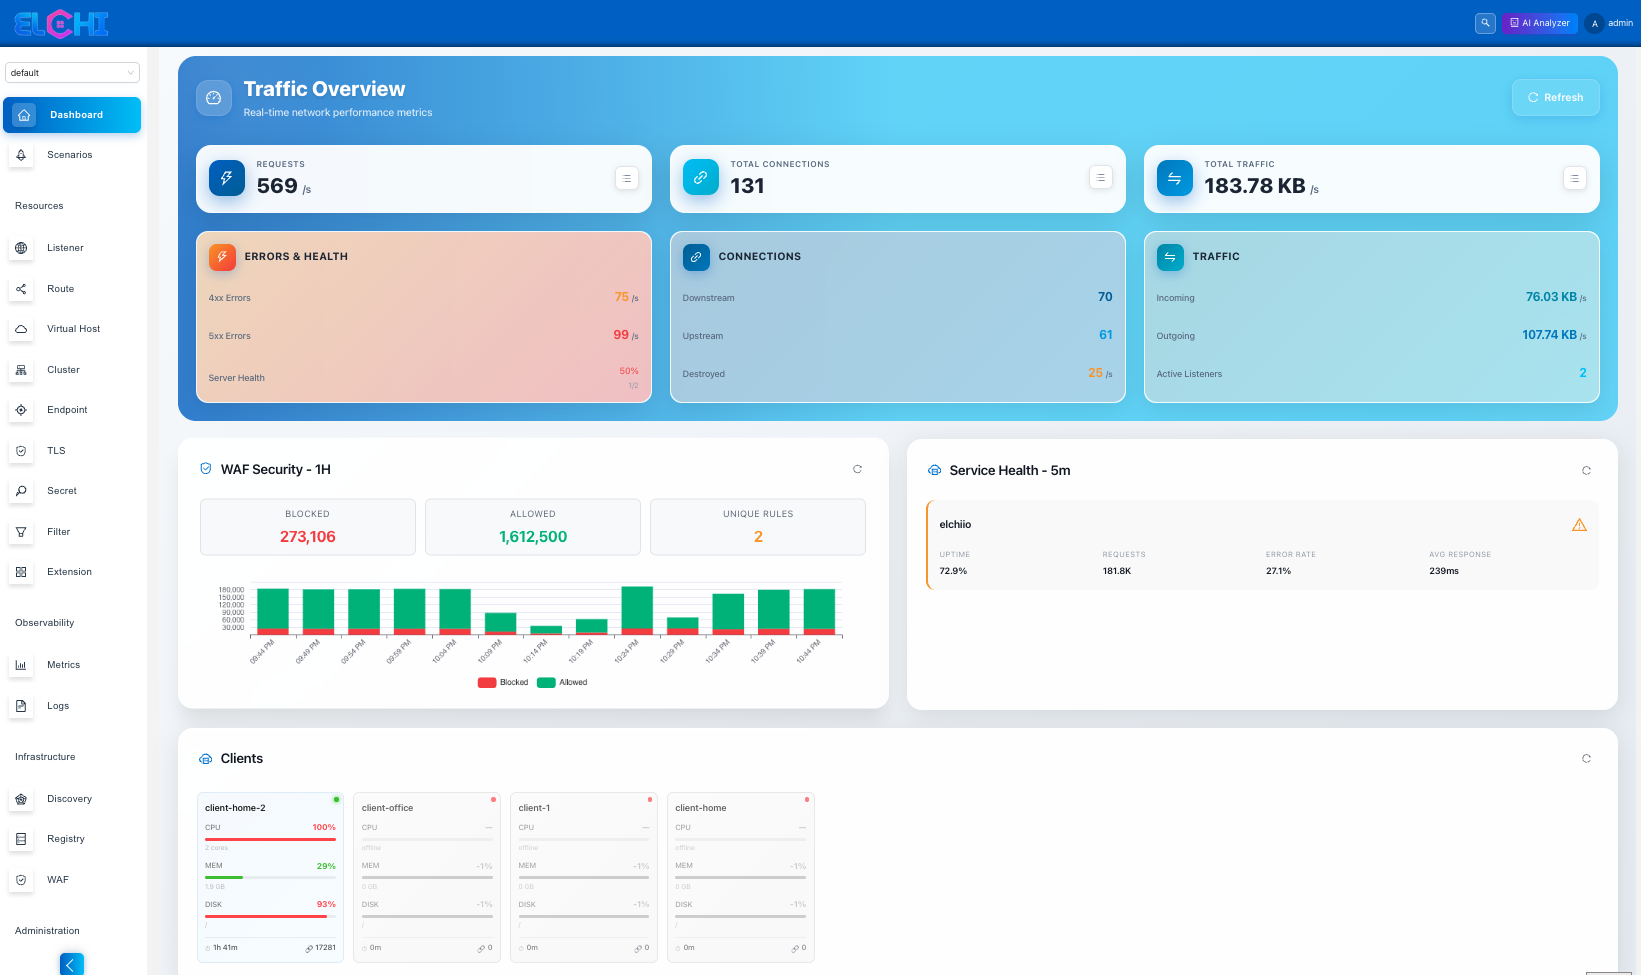
The Dashboard is the landing page after you log in — Elchi's index route renders it, and it is also the catch-all fallback for any unknown path. It gives you a single, scannable view of how the currently selected project is doing: how many resources it holds, which services are throwing errors, and how the traffic and security subsystems are behaving.
A widget board, not a fixed page
The Dashboard is composed of independent widgets laid out on a draggable grid. Each widget owns one concern and fetches its own data, so a slow or empty data source never blocks the rest of the board. The toolbar lets you reorder widgets, resize them, and hide the ones you don't need; your layout preference is remembered.
The built-in widgets are:
| Widget | What it shows | Where it points |
|---|---|---|
| Traffic Overview | Live downstream/upstream connections and request rates | Observability |
| WAF Security | WAF metrics and blocked requests | WAF |
| Shield Security | elchi-shield blocked vs. detected requests | Shield |
| Service Health | A health matrix across services | Services |
| Client Resources | Connected edge clients | Clients |
| GSLB Statistics | GSLB health-check statistics | GSLB |
| Request Rate Timeline | Request rate over time | Observability |
| Response Time Trends | Response-time analysis | Observability |
| Quick Metrics | Key performance indicators | Observability |
| Cluster Health | Cluster health distribution (donut) | Clusters |
| Service Dependencies | Service dependency graph (Sankey) | Dependency graph |
| Resources Overview | Resource counts grid | Resource lists |
The exact widgets you see depend on which platform features are enabled and on your layout preferences. Widgets whose data source is not configured (for example GSLB or Shield) render an empty or muted state rather than an error.
Everything is scoped to a project
The Dashboard reads the active project from the project selector at the top of the left sidebar. Every widget query carries that project and only runs once a project is selected — the resource counts, the error summary, and the security widgets all filter to that project on the backend. Switching projects in the selector re-scopes the whole board at once.
For how projects gate what you can see and do, see Auth and access.
Resource counts
The Resources Overview widget answers "what is in this project right now?" It is backed by two endpoints:
GET /custom/count/all?project=<id>returns a count per resource collection — listeners, routes, virtual hosts, clusters, endpoints, secrets, filters, extensions, and so on. The backend counts every collection in the project and applies your per-user access filter, so the numbers reflect exactly what you are allowed to see.GET /custom/count/filtersbreaks a filter collection down further, grouping by canonical filter name (or by category when a category is supplied). This is what powers the per-type breakdowns on the filter screens.
Each count links through to the corresponding resource list, so the widget doubles as a jump-off point. To understand what these resources are and how they relate, see the configuration model and the dependency graph.
The error summary and clearing errors
The Service Health view is driven by the error summary, which surfaces services that currently have active problems.
Reading the summary
GET /custom/error_summary?project=<id> scans the project's Envoy services for active enhanced errors and returns:
total_error— the total number of active errors across the project.services[]— one entry per affected service, each with anid,name, a rolled-upstatus, and acountof active errors.
Only services that actually have active errors appear, so an empty list means a clean project. The status is computed from the severity of the active errors:
- Critical — the service has at least one active
criticalerror. - Error — at least one active
error-severity item (but nothing critical). - Warning — active items exist but none are error or critical.
Clearing or resolving errors
Once you have fixed the underlying cause, you can clear the stale entries from the Dashboard. This calls:
GET /custom/clear_errors?error_ids=<id1>,<id2>&mode=<clear|resolve>
error_ids— a comma-separated list of the error IDs to act on (required).mode—clearremoves the errors outright;resolvemarks them as resolved and stamps who resolved them and when. Defaults toclear.
Clearing and resolving errors is restricted to the admin and owner roles. Viewers and members receive an "insufficient privileges" response and the action is refused on the backend.
Health at a glance
Taken together, the widgets give you a fast triage loop:
- Service Health tells you whether anything is wrong and where — jump straight to the affected service.
- Resources Overview confirms the project holds what you expect after a deploy.
- Traffic Overview, Request Rate Timeline, and Response Time Trends show whether traffic and latency look normal — dig deeper in Metrics and logs.
- WAF Security and Shield Security show whether the security layers are blocking or merely detecting.
From here, most day-to-day work starts either in the resource model or, for a guided build, in the Scenario wizard.