Dependency Graph, Route Map & Snapshot Dump
Authoring config is only half the job — the other half is understanding what you already have and confirming what actually shipped. Elchi provides three inspection tools for that: the Dependency Graph shows how resources reference each other, the Route Map traces how a request flows through a listener to an upstream, and the Snapshot Dump shows the exact xDS payload the control-plane is serving to a live Envoy node.
All three read the same resource model: every
object is addressed by name, gtype (its Envoy proto type, e.g.
envoy.config.route.v3.RouteConfiguration), collection (the store it lives in,
e.g. listeners, clusters, routes), project, and version (the Envoy
release). The graph tools render with React Flow
(@xyflow/react), with search, category filtering, and node detail popovers.
Dependency Graph
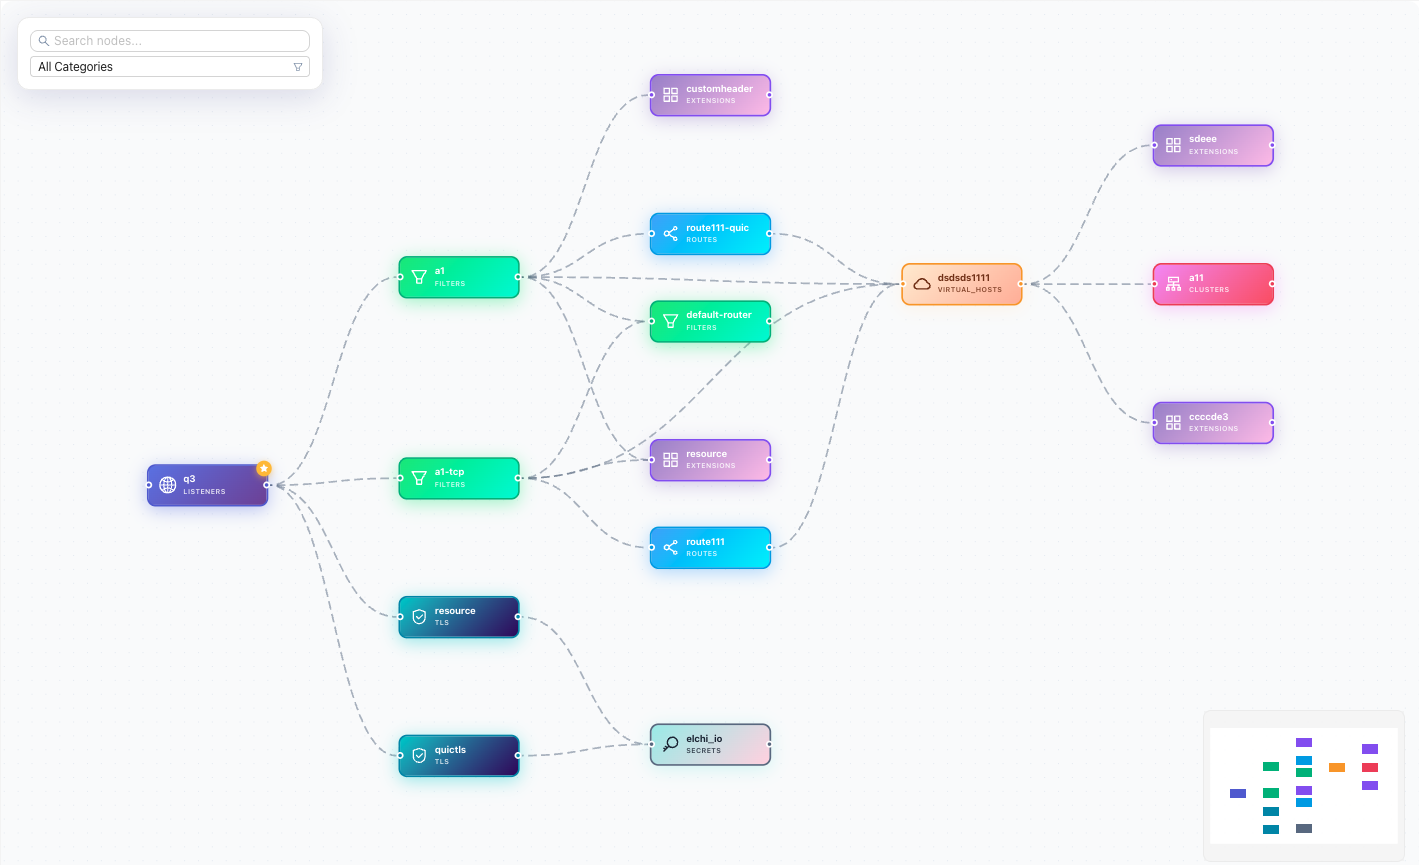
The Dependency Graph answers "what touches this resource, and what does it touch?" Starting from a single resource, the controller walks references in both directions — downstream (what this resource points at) and upstream (what points at this resource) — and returns a node/edge graph you can pan, zoom, filter, and search.
A listener references its HTTP filters and route configuration; a route configuration references its virtual hosts; a virtual host references clusters; a cluster references endpoints, transport sockets, and secrets. The graph makes that whole web navigable in one view.
| Aspect | Detail |
|---|---|
| Endpoint | GET /api/v3/dependency/:name |
| Query params | gtype, collection, project, version |
| Traversal | Upstream and downstream reference collectors |
| Response | Cytoscape-style { nodes: [{ data }], edges: [{ data }] } |
| Node categories | listeners, clusters, routes, virtual_hosts, filters, endpoints, tls, secrets, bootstrap, extensions |
| Extras | Upstream nodes carry a reference count; results are TTL-cached |
Each node carries its gtype, category, a link back to the editor, and a
first flag marking the resource you started from. Upstream nodes include a
count of how many places reference them — a quick signal of blast radius.
Before you change or delete a shared resource, open its Dependency Graph. The
upstream side tells you everyone who depends on it, and the reference count
tells you how widely. A cluster with a high upstream count is a shared upstream —
editing it affects every listener and route pointing at it.
A resource that should link to a cluster or secret but shows no corresponding edge is a dangling reference. The Dependency Graph is the fastest way to find orphaned resources and misconfigured pointers before they reach Envoy.
Route Map
Where the Dependency Graph shows generic references, the Route Map is routing-specific: it expands a listener (or a route config / virtual host) into the request-flow topology — how an incoming request is matched and dispatched to an upstream.
The analyzer resolves the full chain: listener → HTTP filter → route configuration → virtual host → route → cluster / weighted cluster / redirect / direct response. It follows dynamic sources too — RDS-delivered route configurations and VHDS-delivered virtual hosts are resolved and stitched in alongside inline definitions, so the map reflects the effective routing, not just what is written inline on the listener.
| Aspect | Detail |
|---|---|
| Endpoints | GET /api/v3/routemap/:name, GET /api/v3/routemap/supported-types |
| Query params | gtype, collection, project, version (all required) |
| Supported gtypes | HttpConnectionManager, RouteConfiguration, VirtualHost |
| Resolves | Inline, RDS, and VHDS route/virtual-host sources |
| Response | { resource, graph, stats: { nodes, edges } } |
Nodes are typed by role (listener, filter, route config, virtual host, route,
cluster) and carry properties — match rules, rewrites, timeouts, weights — so you
can read why a request lands where it does directly on the map. The
supported-types endpoint returns the three gtypes the Route Map can expand, with
their collection and category.
When a request hits the wrong upstream — or a 404 you didn't expect — open the Route Map for the listener. Following the highlighted path from listener to cluster shows exactly which virtual host matched, which route rule fired, and any rewrite or weighted split applied along the way.
Snapshot Dump
The Dependency Graph and Route Map read your authored config. The Snapshot Dump reads the served config — the live xDS snapshot the control-plane is currently streaming to a specific Envoy node. It is the ground truth of what has actually been published.
Elchi's controller reaches the control-plane over the bridge (a gRPC channel to the control-plane's snapshot service) and fetches the node's snapshot. The request is routed to the owning control-plane using the node's id and Envoy version, so in a multi-control-plane deployment you always get the snapshot from the instance that actually serves that node.
| Aspect | Detail |
|---|---|
| Endpoint | GET /api/v3/bridge/nodes/:nodeID/snapshot |
| Query param | version (Envoy version, used for control-plane routing) |
| Node id | Composed as <listenerName>:<project> in the UI |
| Response | { node_id, resources: [{ type, data }], num_watches, last_watch } |
| Resource types | LDS, CDS, RDS, EDS (and other xDS types) |
| Also | DELETE /api/v3/bridge/nodes/:nodeID/snapshot clears the node's cached snapshot |
The response is rendered as a collapsible JSON tree in the UI, grouped by xDS type,
with num_watches and last_watch telling you whether Envoy is actively subscribed
and when it last pulled. A DELETE on the same path clears that node's cached
snapshot, forcing a clean re-push.
If an edit looks correct in the editor but Envoy isn't behaving as expected, the Snapshot Dump settles it. If your resource is present in the dump, the config was published and Envoy has it — look at routing (Route Map) or the upstream next. If it is absent, the change never reached this node — check that you published, and that the node subscribes to that resource.
Which tool, when
| Question | Tool |
|---|---|
| What references this resource? What does it reference? | Dependency Graph |
| Who breaks if I edit or delete this? (impact analysis) | Dependency Graph (upstream + count) |
| Are there orphaned or dangling references? | Dependency Graph |
| Why did this request route to that upstream? | Route Map |
| How does traffic flow through this listener? | Route Map |
| Did my publish actually reach Envoy? | Snapshot Dump |
| What is Envoy actually serving right now? | Snapshot Dump |
A typical debugging pass runs all three: confirm the config is published (Snapshot Dump), confirm it routes as intended (Route Map), and confirm nothing else was disturbed (Dependency Graph). See also Resources & the Config Model for how these resources are authored and published in the first place.