AI-Powered Analysis
Elchi's AI features let you point any model you like at your own Envoy config and logs to explain, review, and troubleshoot them. Elchi never bundles or brokers an AI provider: analysis runs against your OpenRouter API key and the model you choose (bring-your-own-key), and every call's token usage and cost are recorded so you can track spend.
There are two things the AI can look at — a resource configuration and a set of logs — plus supporting surfaces for model management and usage/quota.
Bring your own key (OpenRouter)
All AI calls require an OpenRouter API key. Elchi resolves the key in this order:
- a per-request
x-openrouter-tokenheader, - the project's OpenRouter token saved in settings (
openrouter_token), or - the
OPENROUTER_API_KEYenvironment variable on the controller.
The normal setup is to save your key once in project settings (Settings →
OpenRouter/Tokens). Until a key is resolvable, the AI surfaces report themselves as
unavailable and prompt you to configure one. You can also set a default model
per project (ai_default_model); when unset, Elchi falls back to its built-in
default model. Because calls go to OpenRouter, the controller needs outbound
network access to OpenRouter.
Service state is exposed at GET /api/v3/ai/status, which reports whether a key is
available, the default_model, and the supported features (analyze,
analyze-logs).
Configuration analysis
The AI Configuration Analyzer reviews a single resource and answers a question about it in natural language. You:
- Select a resource type — standard collections or a specific component/filter
type. Valid collections are
listeners,clusters,routes,endpoints,virtual_hosts,filters,extensions,secrets, andtls. - Select the resource from your project (searchable, version-tagged).
- Ask a question — e.g. "What filters are configured and what do they do?", "Are there any security vulnerabilities?", "How can I improve performance?", "What are the dependencies of this listener?"
- Optionally toggle Include dependency analysis (on by default) so the model also considers resources this one references. When dependencies are included, certificate and secret material is deliberately excluded from what's sent.
The request is served by POST /api/v3/ai/analyze. Results render as structured
cards — analysis, suggestions, and warnings — alongside the resolved resource
configuration details, a dependencies panel, and related resources. Each
analysis also reports its own token usage (input, output, total) and estimated
cost in USD.
Log analysis
Log analysis correlates raw logs with the relevant config to explain what went wrong and why. It's surfaced from the Logs view (see Metrics & Logs) so you can hand a slice of Envoy logs straight to the model in context.
Backed by POST /api/v3/ai/analyze-logs, it takes a resource (so the model has the
config context), the logs text, and an optional question — if you don't ask
one, Elchi uses a default "analyze these logs and identify any issues, errors, or
important information." Logs are capped at 999 lines per request; larger
inputs are rejected with a clear message rather than silently truncated. Like
config analysis, dependency context is included by default.
The response is rendered into readable sections — Log Summary, Detected Errors, Root Cause Analysis, Solution Recommendations, Monitoring Recommendations, Next Steps, and more — with syntax-highlighted code and YAML blocks, plus the number of errors detected and the token usage for the call.
Model management
Because you bring your own OpenRouter key, you also pick the model:
- List models —
GET /api/v3/ai/modelsreturns the models available to your OpenRouter key, so you can choose one as the project default or per analysis. - Test a model —
POST /api/v3/ai/models/testsends a tiny connectivity probe to a specificmodel_idand reports success, round-trip latency, and the token usage of the test. Use it to confirm a key/model works before running a real analysis.
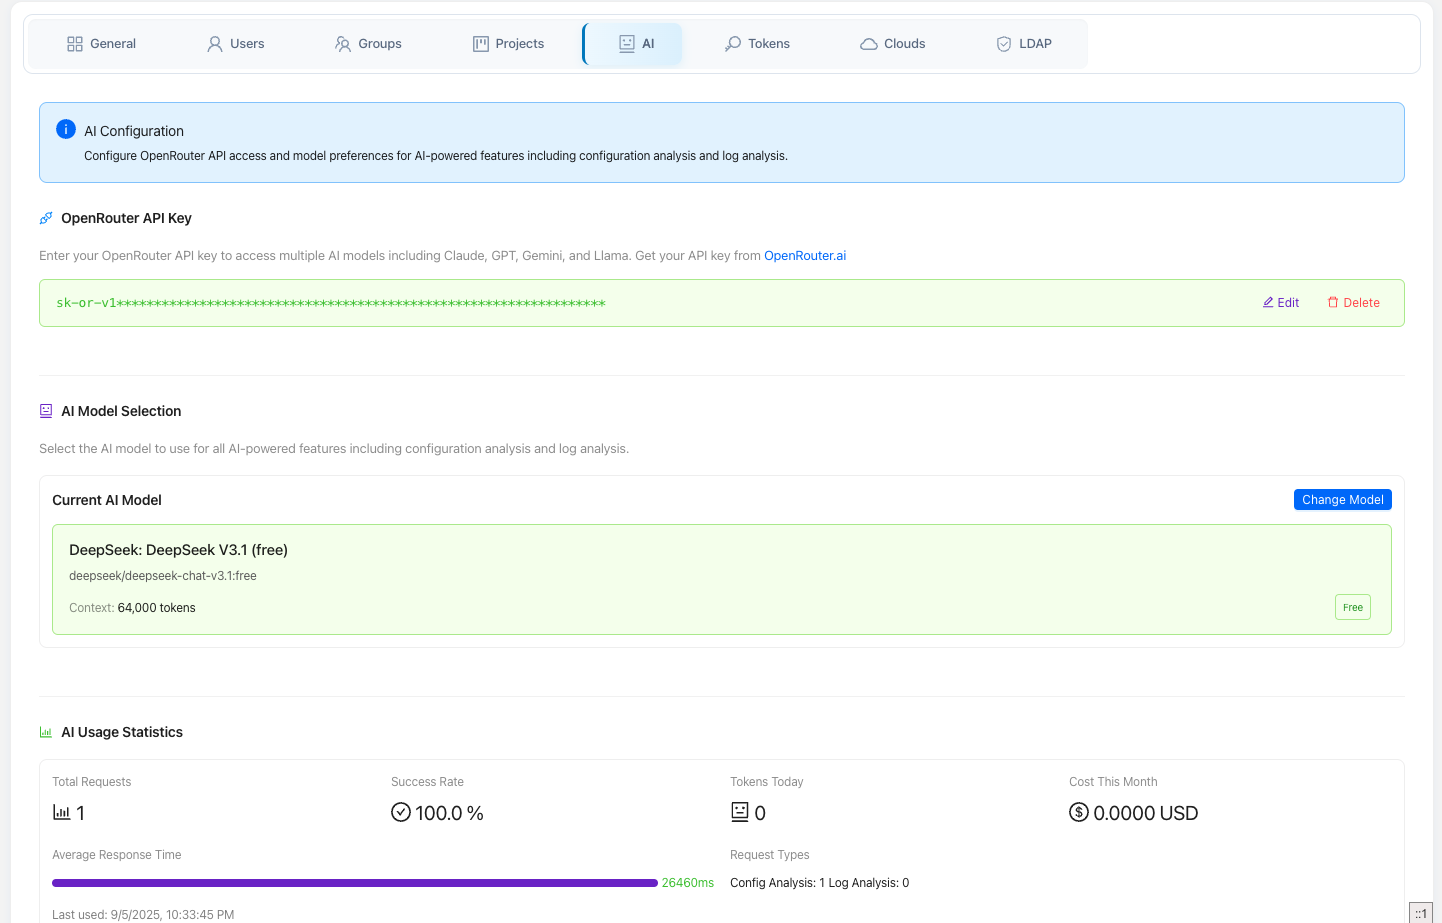
Usage, cost, and quota
Every AI call is metered, and the usage surface lets you monitor and clean up that history:
| Endpoint | What it gives you |
|---|---|
GET /api/v3/ai/usage/status | Current status for a project: whether a token is configured, service availability, supported features, max_tokens_per_request (4000), plus a usage summary — total requests, tokens used today, tokens used this month, last used, and success rate. |
GET /api/v3/ai/usage/stats | Aggregate usage statistics for the project. |
GET /api/v3/ai/usage/recent | The most recent usage records (default 50, up to 200). |
DELETE /api/v3/ai/usage/cleanup | Prune old usage records. Retention defaults to 90 days and is floored at a 7-day minimum; this is an admin action. |
Per-analysis token and cost figures shown in the UI come from the same tracking, so you can attribute spend to individual analyses as well as watch the project-wide totals.
Elchi doesn't ship an AI provider. Analysis runs against the OpenRouter key and model you configure and requires outbound access to OpenRouter. Configuration and log analysis operate on your resources and the logs you submit; when dependency analysis is on, certificate and secret material is excluded from what's sent.